
Ghana Pension Calculator
Estimate what your retirement savings could be worth at retirement. Enter your age, salary and contribution rate, and the calculator projects your pension pot for a Tier 2 Occupational scheme, a Tier 3 Provident Fund, or a Tier 3 Personal Pension.
Important
This calculator provides indicative projections only. It does not constitute financial, tax, legal, or actuarial advice. Final benefits depend on actual contributions, investment returns, fees, scheme rules, tax rules, and applicable NPRA regulations.
Tier 2 Occupational Pension Scheme
Estimate the growth of your mandatory occupational pension contributions administered under the privately managed Tier 2 structure.
Tier 2 is the mandatory privately managed occupational pension component. This calculator excludes SSNIT Tier 1.
Your details
Shared across all scenarios
Indicative only — actual returns vary and are not guaranteed.
Used to show real, inflation-adjusted value in today's money.
Scenario inputs — Tier 2 Occupational Pension Scheme
Statutory default is 5% of monthly basic salary.
Estimated retirement balance
Projected over 25 years to age 60
Estimated retirement balance for Tier 2 Occupational Pension Scheme: GH₵ 829,829.32 (nominal). This is an estimate, not a guaranteed benefit.
Estimated retirement balance
GH₵ 829,829.32
Real value today: GH₵ 121,169.94
Total contributions
GH₵ 189,747.11
All contributions over the period
Estimated investment growth
GH₵ 620,082.20
Earnings net of charges
Projected lump sum at retirement
GH₵ 829,829.32
Subject to scheme & NPRA rules
Tier 2 highlights
Monthly Tier 2 contribution
GH₵ 250.00
5.0% of current salary
Final salary (annual, est.)
GH₵ 304,342.02
Contribution adequacy
≈ 2.7× final annual salary
Adequacy: Low = below 1× final salary · Moderate = 1–3× · Strong = above 3×.
Balance growth over time
How your estimated balance builds up to retirement
Contributions vs investment growth
Contributions & opening balance vs investment growth
Detailed projection table
Year-by-year projection (scroll for more)
| Age | Year | Annual contribution | Cumulative contribution | Investment growth | End-year balance | Real value (today) |
|---|---|---|---|---|---|---|
| 36 | 2027 | GH₵ 3,000.00 | GH₵ 3,000.00 | GH₵ 2,235.03 | GH₵ 25,235.03 | GH₵ 23,365.77 |
| 37 | 2028 | GH₵ 3,210.00 | GH₵ 6,210.00 | GH₵ 5,023.32 | GH₵ 31,233.32 | GH₵ 26,777.54 |
| 38 | 2029 | GH₵ 3,434.70 | GH₵ 9,644.70 | GH₵ 8,444.66 | GH₵ 38,089.36 | GH₵ 30,236.56 |
| 39 | 2030 | GH₵ 3,675.13 | GH₵ 13,319.83 | GH₵ 12,588.68 | GH₵ 45,908.51 | GH₵ 33,744.12 |
| 40 | 2031 | GH₵ 3,932.39 | GH₵ 17,252.22 | GH₵ 17,555.95 | GH₵ 54,808.17 | GH₵ 37,301.52 |
| 41 | 2032 | GH₵ 4,207.66 | GH₵ 21,459.87 | GH₵ 23,459.27 | GH₵ 64,919.15 | GH₵ 40,910.07 |
| 42 | 2033 | GH₵ 4,502.19 | GH₵ 25,962.06 | GH₵ 30,425.05 | GH₵ 76,387.11 | GH₵ 44,571.15 |
| 43 | 2034 | GH₵ 4,817.34 | GH₵ 30,779.41 | GH₵ 38,594.82 | GH₵ 89,374.23 | GH₵ 48,286.11 |
| 44 | 2035 | GH₵ 5,154.56 | GH₵ 35,933.97 | GH₵ 48,126.99 | GH₵ 104,060.96 | GH₵ 52,056.39 |
| 45 | 2036 | GH₵ 5,515.38 | GH₵ 41,449.34 | GH₵ 59,198.73 | GH₵ 120,648.07 | GH₵ 55,883.40 |
| 46 | 2037 | GH₵ 5,901.45 | GH₵ 47,350.80 | GH₵ 72,008.06 | GH₵ 139,358.86 | GH₵ 59,768.63 |
| 47 | 2038 | GH₵ 6,314.56 | GH₵ 53,665.35 | GH₵ 86,776.22 | GH₵ 160,441.57 | GH₵ 63,713.56 |
| 48 | 2039 | GH₵ 6,756.57 | GH₵ 60,421.93 | GH₵ 103,750.22 | GH₵ 184,172.15 | GH₵ 67,719.72 |
| 49 | 2040 | GH₵ 7,229.54 | GH₵ 67,651.46 | GH₵ 123,205.76 | GH₵ 210,857.22 | GH₵ 71,788.67 |
| 50 | 2041 | GH₵ 7,735.60 | GH₵ 75,387.07 | GH₵ 145,450.35 | GH₵ 240,837.42 | GH₵ 75,922.00 |
| 51 | 2042 | GH₵ 8,277.09 | GH₵ 83,664.16 | GH₵ 170,826.92 | GH₵ 274,491.08 | GH₵ 80,121.33 |
| 52 | 2043 | GH₵ 8,856.49 | GH₵ 92,520.65 | GH₵ 199,717.64 | GH₵ 312,238.29 | GH₵ 84,388.31 |
| 53 | 2044 | GH₵ 9,476.45 | GH₵ 101,997.10 | GH₵ 232,548.31 | GH₵ 354,545.41 | GH₵ 88,724.64 |
| 54 | 2045 | GH₵ 10,139.80 | GH₵ 112,136.89 | GH₵ 269,793.16 | GH₵ 401,930.05 | GH₵ 93,132.04 |
| 55 | 2046 | GH₵ 10,849.58 | GH₵ 122,986.48 | GH₵ 311,980.11 | GH₵ 454,966.59 | GH₵ 97,612.27 |
| 56 | 2047 | GH₵ 11,609.05 | GH₵ 134,595.53 | GH₵ 359,696.73 | GH₵ 514,292.26 | GH₵ 102,167.11 |
| 57 | 2048 | GH₵ 12,421.69 | GH₵ 147,017.22 | GH₵ 413,596.67 | GH₵ 580,613.89 | GH₵ 106,798.41 |
| 58 | 2049 | GH₵ 13,291.21 | GH₵ 160,308.42 | GH₵ 474,406.97 | GH₵ 654,715.40 | GH₵ 111,508.04 |
| 59 | 2050 | GH₵ 14,221.59 | GH₵ 174,530.01 | GH₵ 542,935.98 | GH₵ 737,465.99 | GH₵ 116,297.90 |
| 60 | 2051 | GH₵ 15,217.10 | GH₵ 189,747.11 | GH₵ 620,082.20 | GH₵ 829,829.32 | GH₵ 121,169.94 |
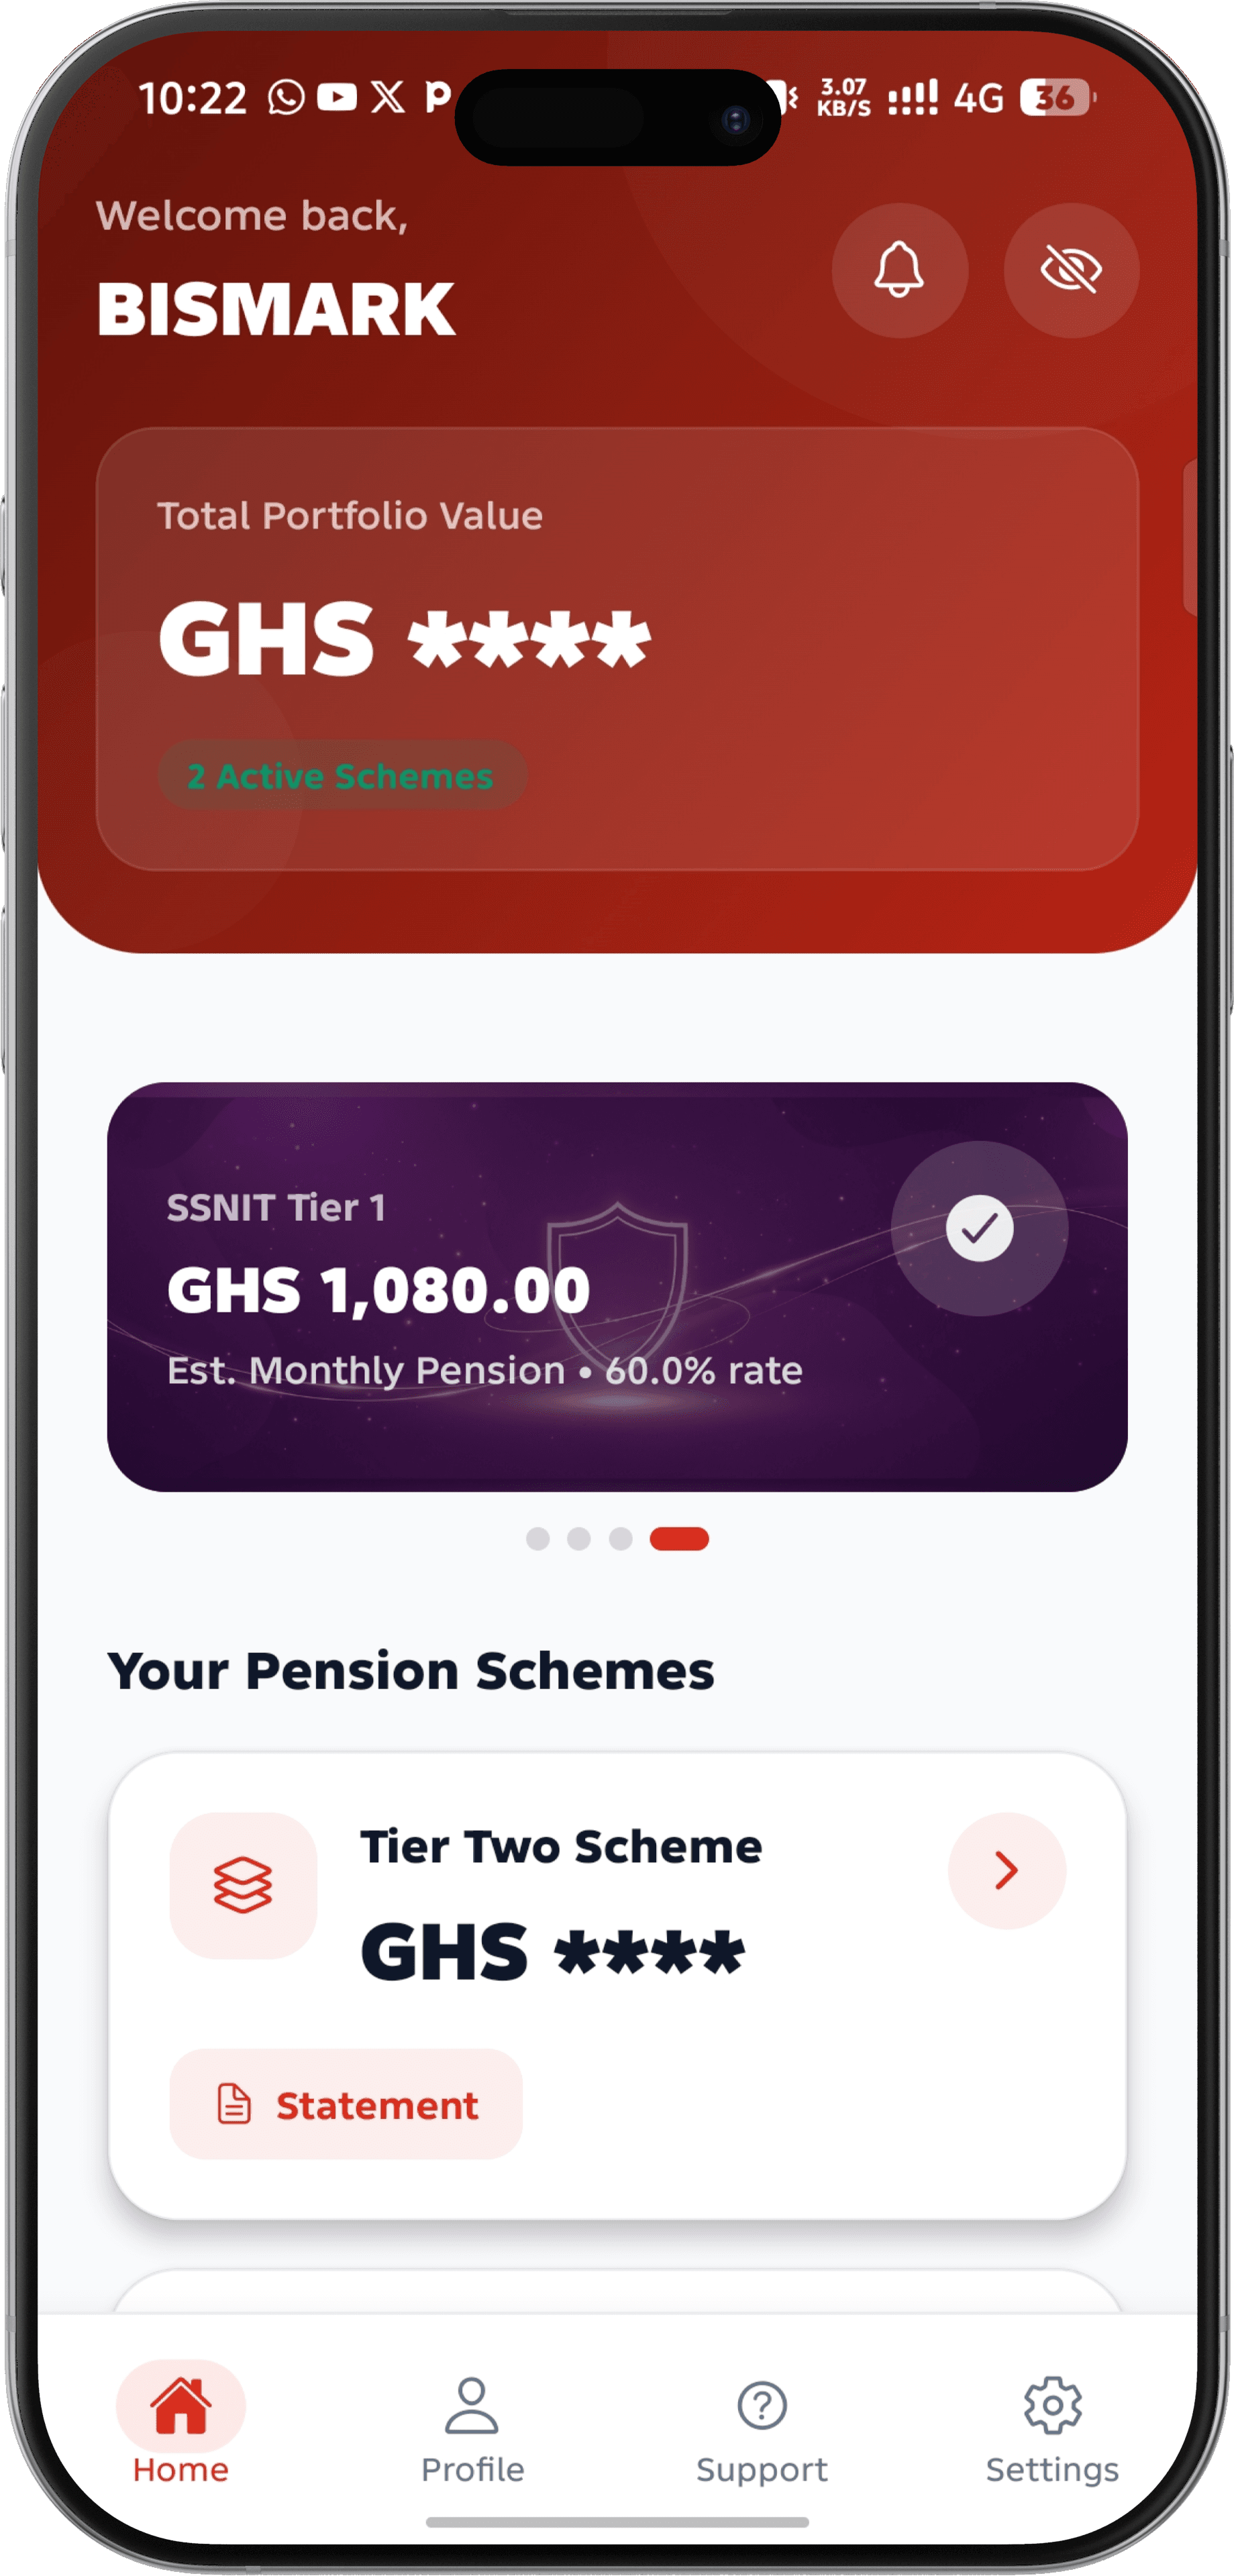
Take Your Pension Planning Further
You've estimated your retirement benefits. Continue your retirement planning journey with the Standard Pensions Trust Mobile App and stay connected to your pension account wherever you are.
Your pension journey doesn't end with a calculation. Use the Standard Pensions Trust Mobile App to monitor your savings, track contributions, and stay informed about your retirement benefits.
- View Tier Two Scheme Statements
- View Provident Fund Statements
- Monitor Pension Growth Over Time
- Receive Real-Time Contribution Alerts
- Update Personal Records
- Update SSNIT Tier One Contribution Records
- View Pension Eligibility Status
- Access Estimated Monthly Retirement Benefits
- Access Member Support Services
- Secure Biometric Login
Ready to act on your projection?
Standard Pensions Trust administers Tier 2 and Tier 3 schemes. Talk to us to turn this estimate into a plan.
Why this matters
Scope: This tool covers only Tier 2 (mandatory occupational) and Tier 3 (voluntary provident fund and personal pension) schemes administered by a private corporate trustee. SSNIT Tier 1 is a separate, state-managed basic national scheme and is outside the scope of this calculator — no Tier 1 benefit formulas are calculated here, and Standard Pensions Trust does not administer Tier 1. Figures shown are estimated retirement balances, not guaranteed benefit entitlements. Actual returns may vary, and fees, taxes, withdrawals, scheme rules, and regulatory changes may affect final outcomes.
Important
This calculator provides indicative projections only. It does not constitute financial, tax, legal, or actuarial advice. Final benefits depend on actual contributions, investment returns, fees, scheme rules, tax rules, and applicable NPRA regulations.
© 2026 Standard Pensions Trust · Indicative projection tool · National Pensions Act, 2008 (Act 766)
How This Pension Calculator Works
Formal-sector workers in Ghana contribute 18.5% of basic salary across the first two tiers: 13.5% to SSNIT (Tier 1, the state scheme, which pays a monthly pension for life) and 5% to a licensed private trustee such as Standard Pensions Trust (Tier 2). Tier 3 is voluntary and can be added on top by you, your employer, or both.
This calculator models the three schemes a trustee administers — Tier 2 Occupational, Tier 3 Provident Fund, and Tier 3 Personal Pension. It does not project your SSNIT Tier 1 pension.
Contributions are added monthly and compounded at your assumed investment return, net of annual scheme charges. Your salary grows each year at the rate you set, so contributions rise with it. Results are shown both in nominal cedis and as an inflation-adjusted “real” value, so you can see what the projected pot would be worth in today's money.
Every input is an assumption you control, and projections are indicative only. Actual benefits depend on your real contribution history, realised investment returns, and the NPRA rules in force when you retire. Nothing here constitutes financial, tax, legal, or actuarial advice.